
Around the World in 60 Days: How We Launched Our UFO Explorer Pages in Just Two Months
Since the launch of our free Enigma app last June, iOS users have had access to our platform of over 280,000 UAP sightings with thousands of videos, photos and audio. However, everyday we get tons of requests from people who don’t have iOS phones, and we are conscious of wanting to provide access.
This fall our team is excited to release an Android version for the enjoyment of millions more users worldwide. But we know that not all users are as nimble or comfortable on smartphones, and that it can be hard to read data on a small screen. So we decided to jumpstart providing access to users on the web.
As we are a small team of engineers and developers, we knew we couldn’t build everything, so the first thing we had to do was decide the scope of what we could make available easily on the web.
We constantly listen to users and observe what they prefer to do in the app. We observed that our users are often searching for other sightings near them, and at the city, state, and country level. Additionally, we often get requests from local media outlets for sightings data in their local city or state, and our small team just doesn’t have the bandwidth to pull data for each request. There was a clear and pressing need for regional sighting insights to be easily accessible to web users, researchers, and journalists.
Our solution? The Enigma Explorer Pages: Trending video sightings and data insights pages for every US state and over 200 countries and territories worldwide.
Background: Start Local
Today, 78% of our submissions come from the United States, which is largely driven in part by the fact that our app only exists on iOS today and only in English. So we decided to start by prioritizing the project with pages dedicated to each US state. In its first iteration, our Explore route led directly to our United States index, displaying a choropleth map based on total sighting volume. This presented us with our first challenge: taking all of our sighting data, encompassing both user submissions and third-party historical sources, and bucketing it by respective region.
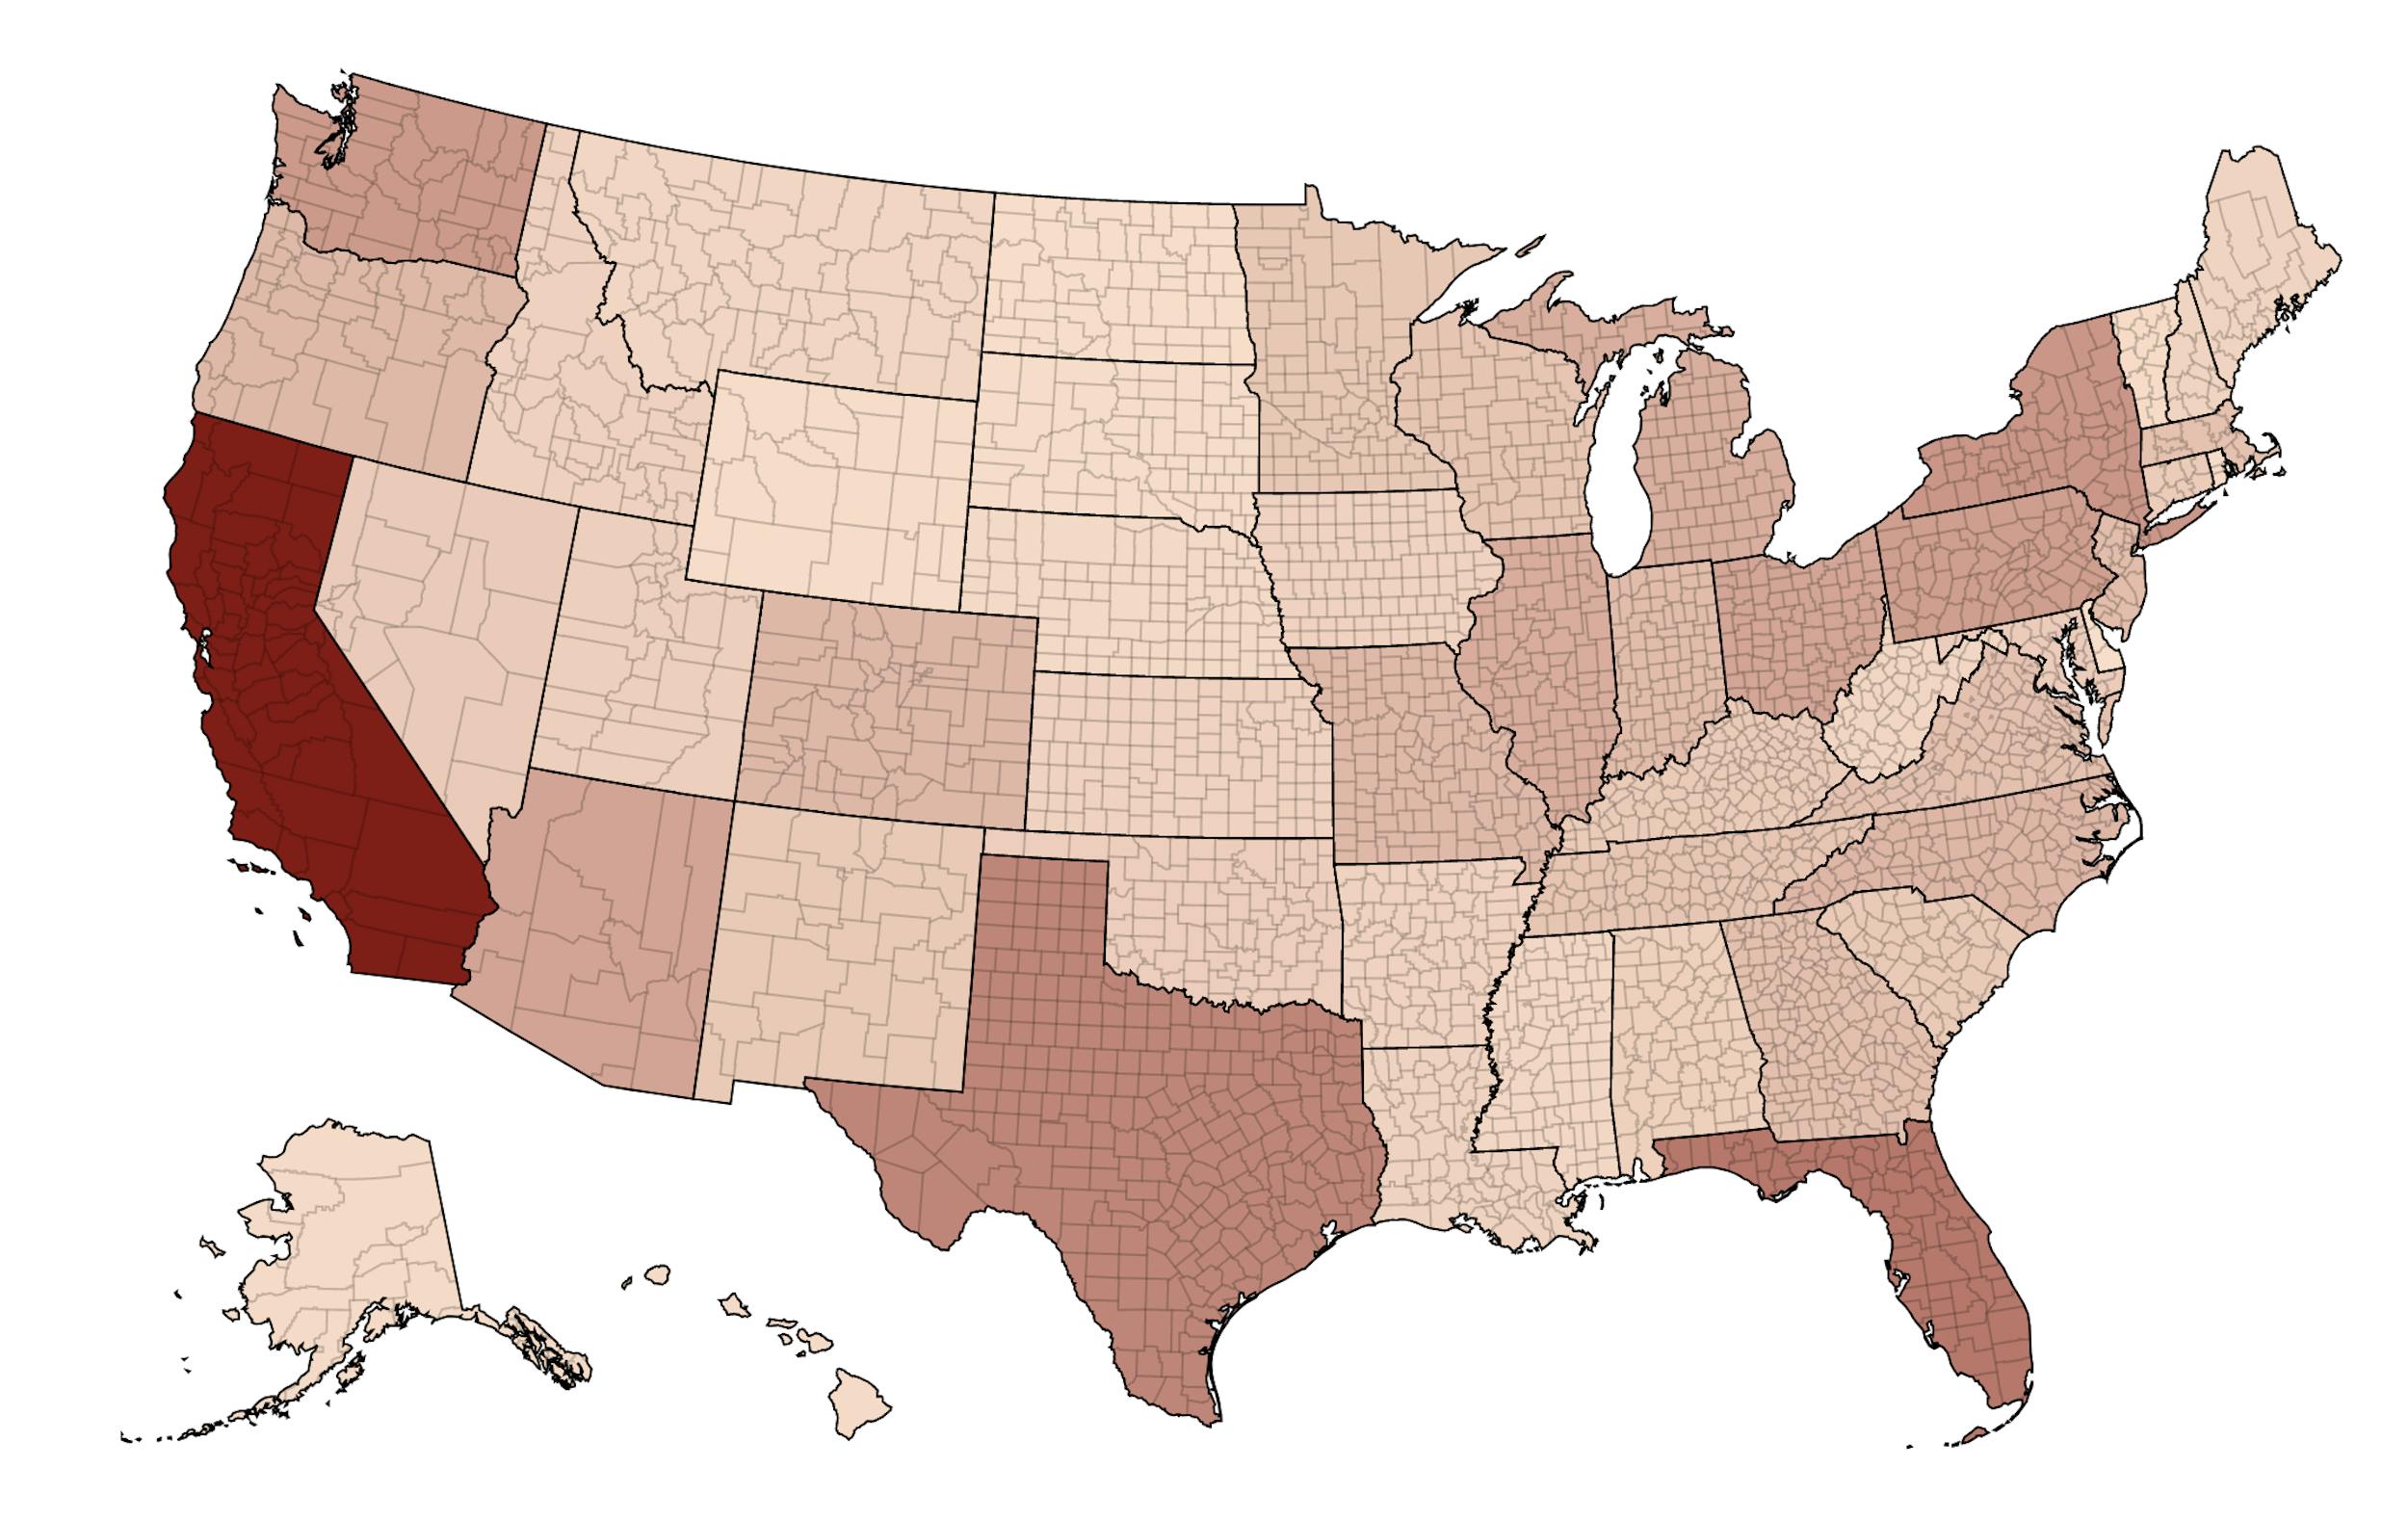
This would set the standard by which we would sort all of our region explorer data: using the NGA Geographic Names Server, we created an index table for fast geospatial lookups of map shapes. We are then able to query within this data. Eventually, we can get even more granular with our map; with over 2 million geonames in the United States, we could display sighting counts by county, and provide greater interactivity before diving into each individual state.
We provide a state index sortable by alphabetical order and by total number of sightings. Unsurprisingly, California comes out on top, as sheer population density typically drives more submissions. We are working to show sighting counts adjusted for population as these pages evolve.
Sightings Data Trends
Internally, we have an abundance of data and trends — everything from the duration of a sighting to whether or not it was captured by an additional sensor. We know which of our submitters are from professional groups, such as scientists, pilots and more. We also know the movement patterns of an object. All this data is vital to us on an individual sighting level, factoring into our proprietary Enigma score, but which data tells the most compelling story about a state?
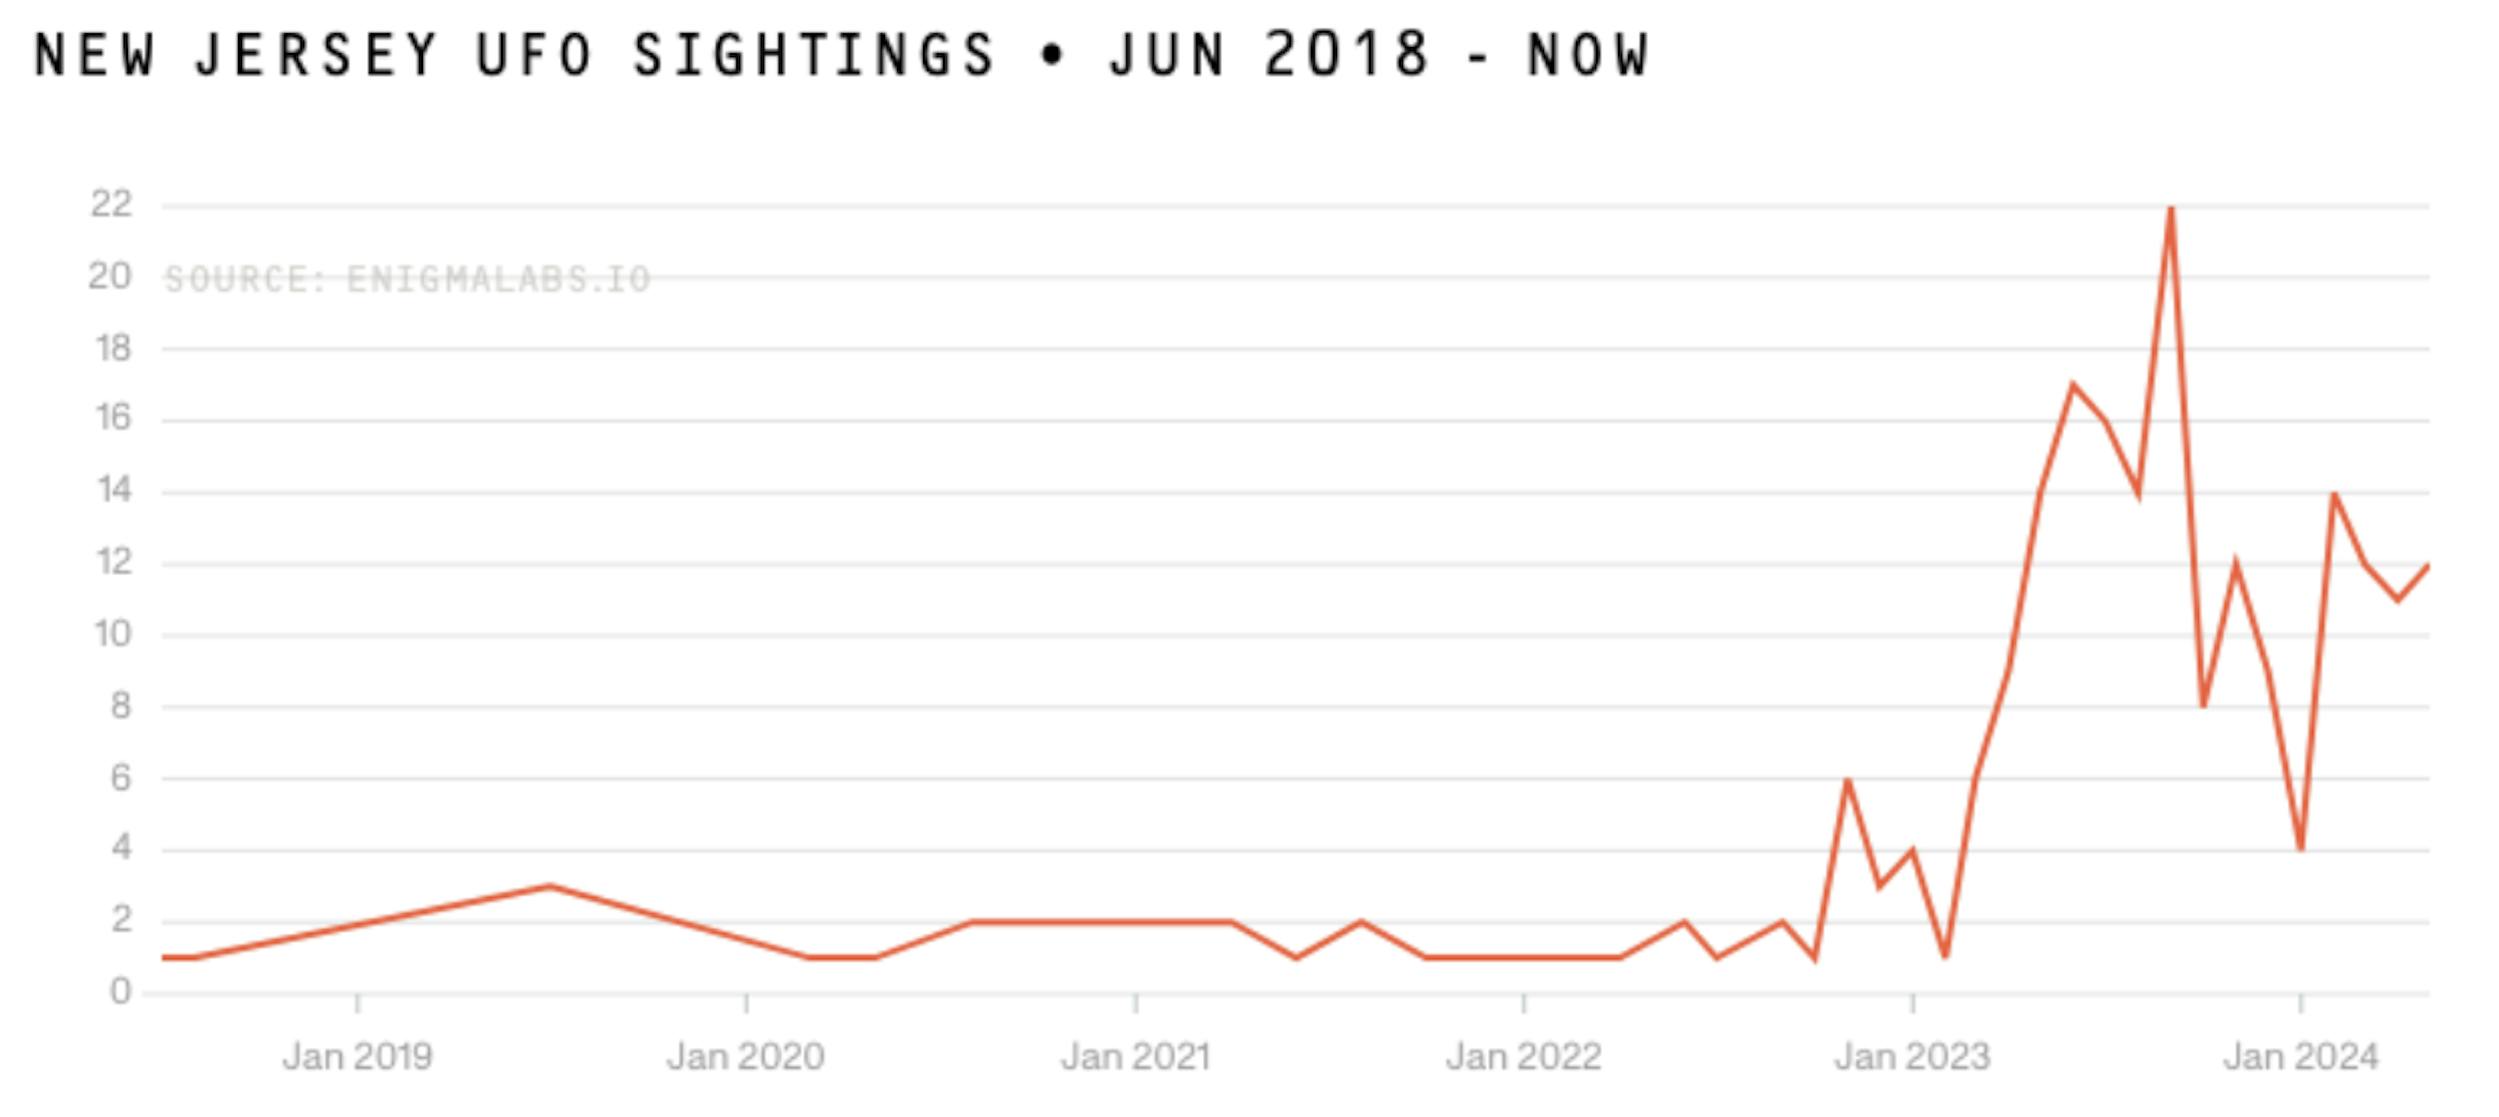
As our skywatching community grows and we see greater understanding of UFO/UAP, our team decided that a high-level time series of sightings per state would be the one of the most critical sighting trends to surface more easily to users. The vast majority of our users submit sightings shortly after they see or experience the UAP, so in future we are working towards capturing a near-real-time story of how many sightings happened in a given state per month.
At a state level, this is still fairly broad. However, in conjunction with our ongoing work on triangulating objects, we have the potential to connect similar sighting experiences in a geographic area at any given time and establish patterns. For example, how many of the 22 sightings we received from New Jersey in December 2023 could have been the same object?
To that end, we also identify up to five cities where we have received the most sightings, calculated within 5000 meters of each city center. Leveraging the power of our geospatial lookups, we could potentially identify further hotspots such as military bases and other locations of interest within a state.
As an example of the structured data we collect, we are displaying the top shapes per state. Circles, spheres, and points of light continue to dominate across the US.
Sighting media and stories
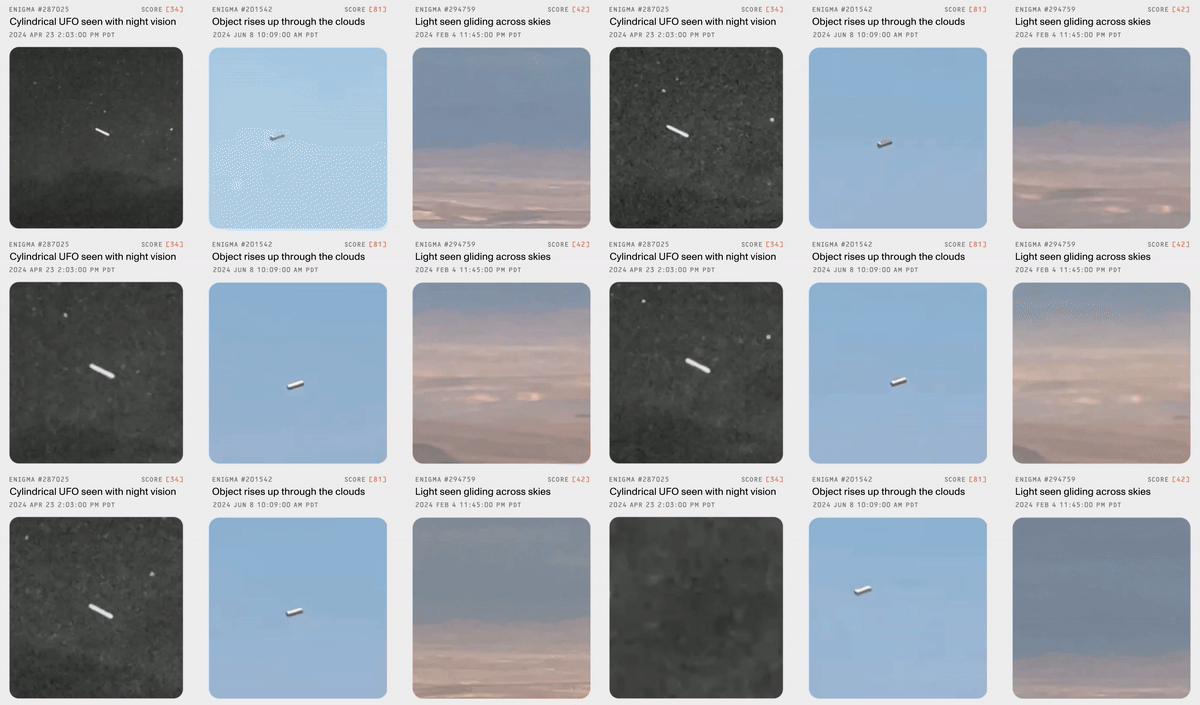
Nothing is more important to us than our sighting community — our users’ submissions are the heart of the Enigma app. That’s why we’re also excited to use our web platform to surface and highlight individual sightings for the first time. While non-app submitters receive web preview links to their sightings upon approval, all web visitors are now able to see the most compelling media on both the state and country level. We encourage users to explore sightings by region on our website — each region page auto selects and highlights up to six randomized videos from that state or country. We hope to expand this into a network of related sightings, a preview of our content feed online, and other formats to better showcase our users’ stories.
Going Global
As the US still makes up the bulk of our submissions, we had significantly less data to pull from worldwide. The United Kingdom, Canada, Italy, and Australia round out the top 5 countries we have received sightings from. We expect this data to explode once we launch Android and also localize into foreign languages in coming months.
Paired with our database of historical sightings, we are able to display maps of thousands of sightings across more than 200 countries and territories. On any country’s dedicated explorer page, a user can see how many sightings have been submitted in that country, as well as view sighting videos submitted by local users. In order to accommodate the smaller data sets, we are looking to expand sighting highlights to other media types, showing off compelling images and audio stories as well as video. As interest grows, we also hope to show top shapes for each country, as well as the same time series charts that are currently available for US states.
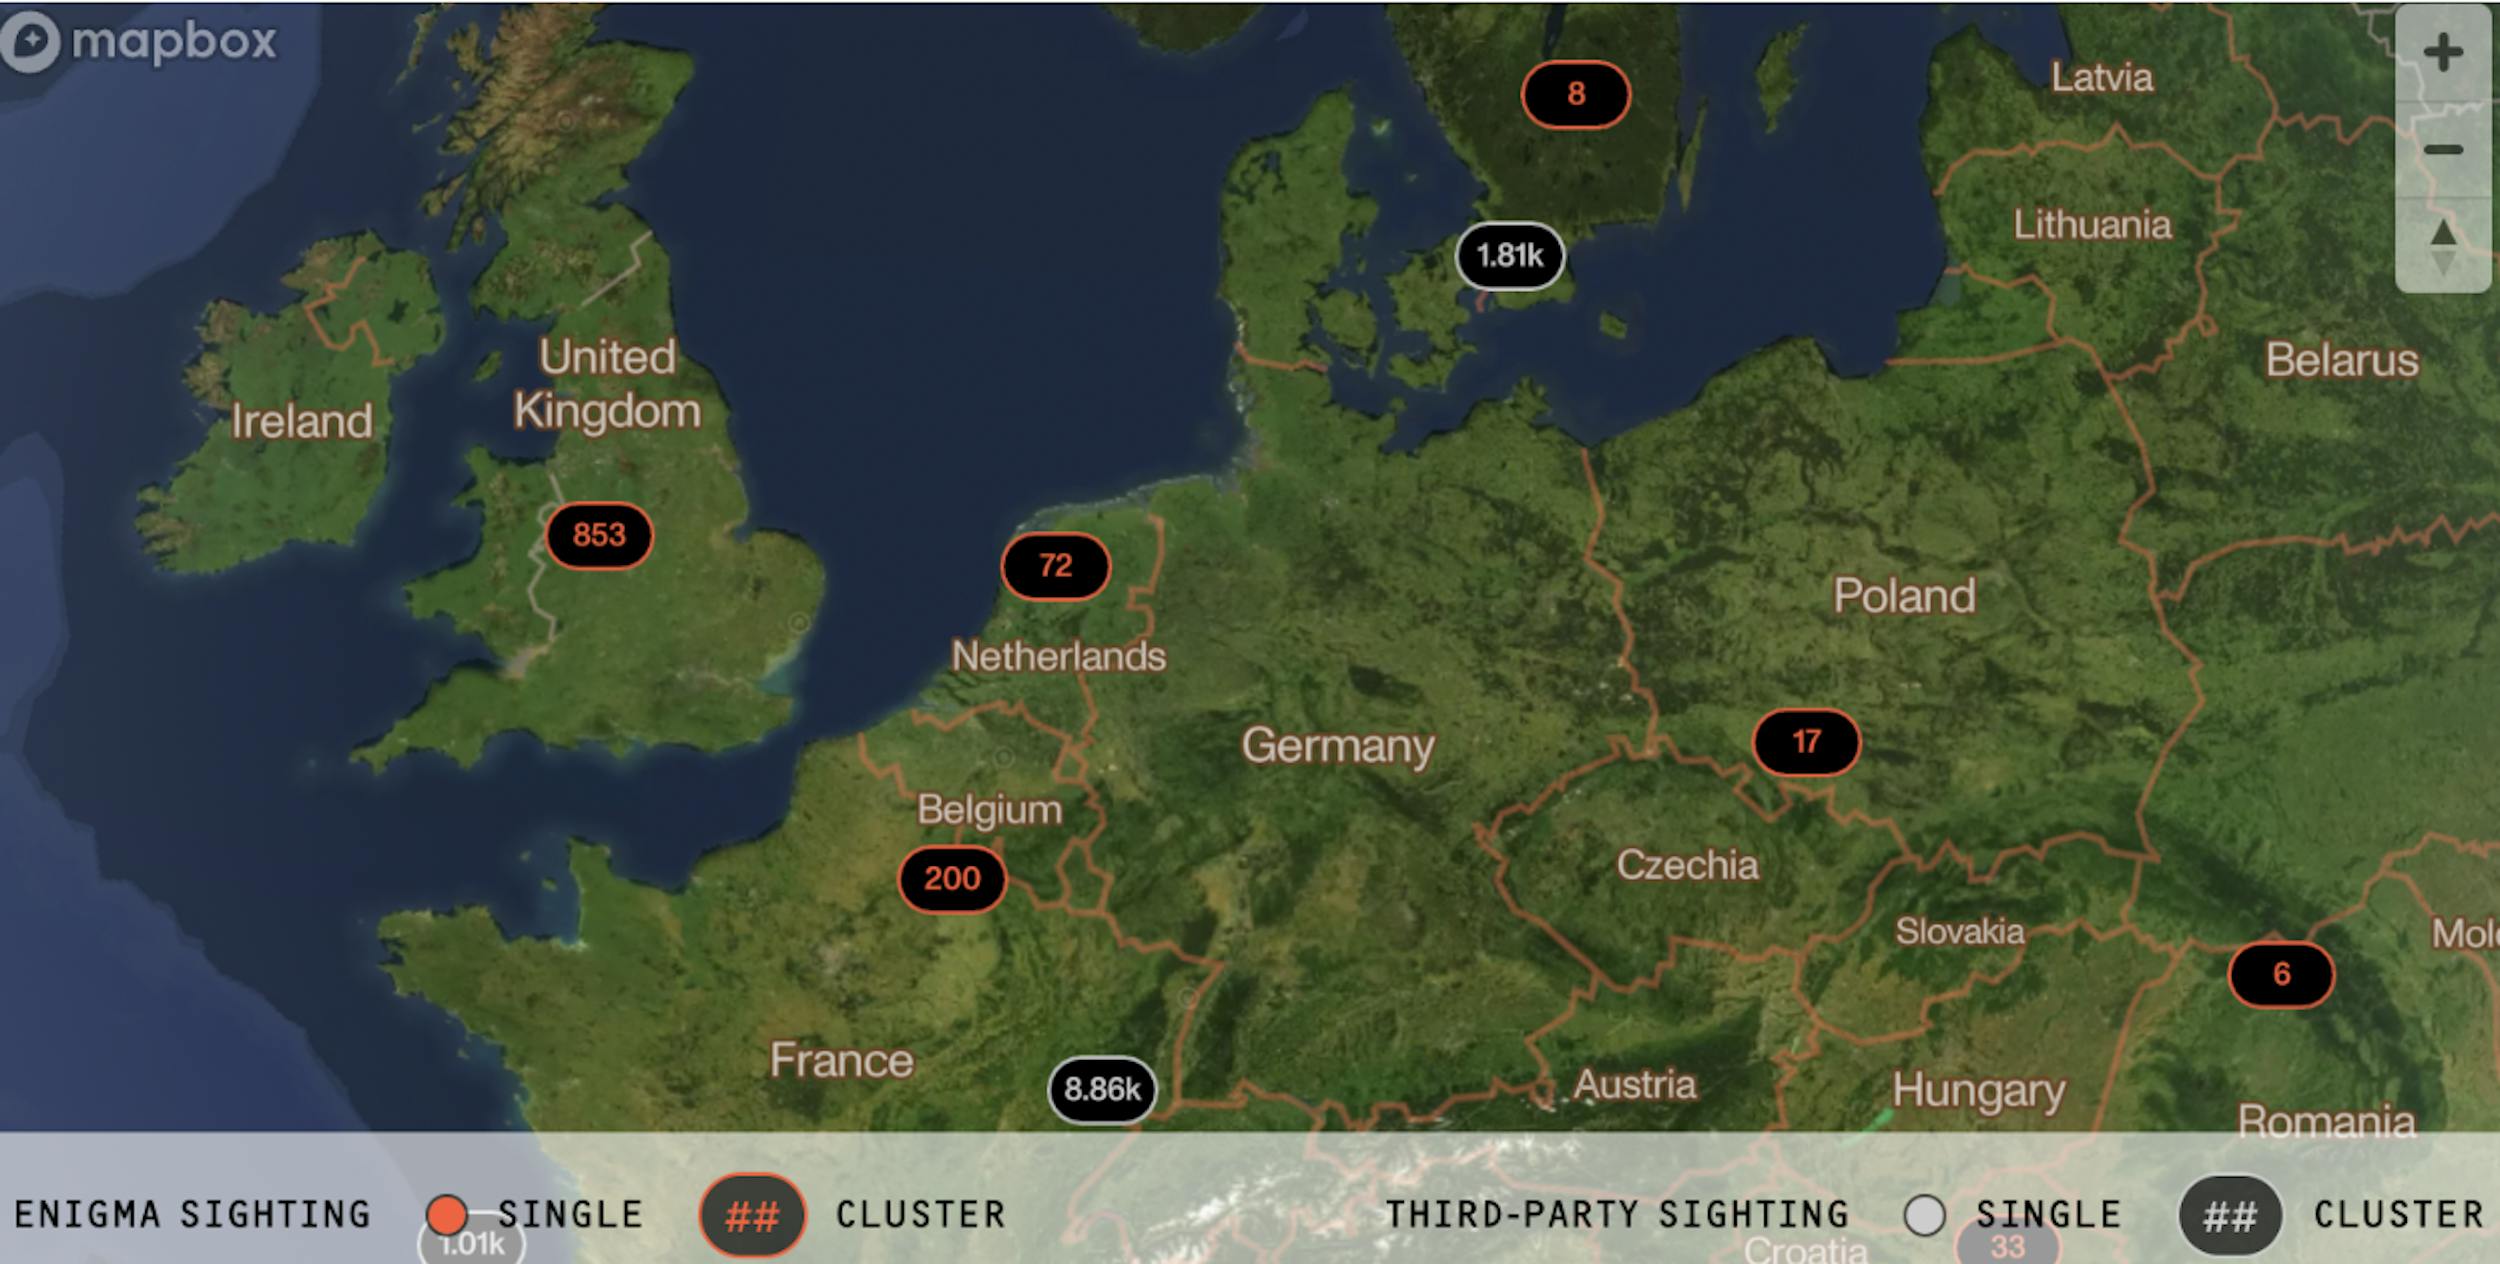
We’ve already seen interest in UFO/UAP piqued around the world — Switzerland’s most-subscribed daily newspaper ran a story heavily featuring our local page sighting data, a number of sighting stories have reached us from Japan, and we would love to grow the conversation globally.
So please check out the Sighting Explorer Pages, download the Enigma app and be the first to submit a sighting from your country! Android user? Sign up for the waitlist and get notified first of updates.